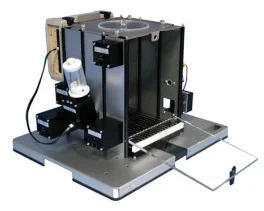
Presentation
BIOSEB offers physiological research systems for a variety of applications, including cardiovascular studies, blood pressure, cardiac electrophysiology, hemodynamic studies of the pulmonary and coronary systems, studies of isolated tissues in organ or tissue baths, epithelial studies, and many applications in neurophysiology.
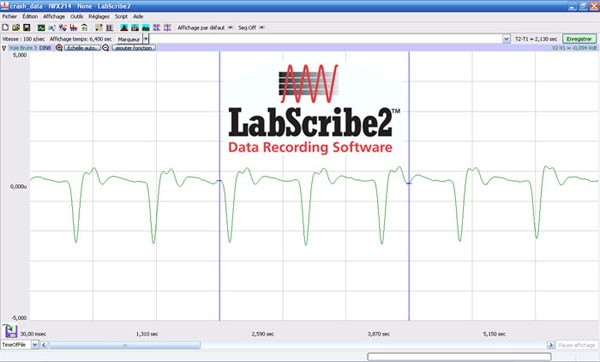
The acquisition and data display in the main software program, LabScribe, is easy and straightforward. It supports real units and a time based display that is not coupled to sample rate. You can display up to 1,000,000 data points per channel on the screen. Scrolling, zoom-in and zoom-out tools, together with a searchable list of user interventions, make finding important areas of data easy. And, of course, you can print or export anything that you see.
 Operating principle Operating principle
Analysis
Although the acquisition process has been made almost transparent, the real power of BIOSEB research systems rests in the analytical routines that can be applied to research data. The LabScribe data recording software provided with BIOSEB data acquisition hardware has a powerful array of built-in data analysis tools. It strikes a balance between the straightforward, general operations that everyone uses and the vertical, complex routines that only you use. The result is a powerful analytical tool that can go to work on your data right away, or be customized to do very specific and complex analyses.
Data analysis with LabScribe is divided into five types. Each type or 'kind' addresses specific analytical requirements:
• Analyses of the First Kind: Wave-to-Wave Transforms
• Analyses of the Second Kind: Reduced Data
• Analyses of the Third Kind: Redisplayed Data
• Analyses of the Fourth Kind: Detected Data Conditions
• Analysis of the Fifth Kind: Scripting | 
Cardiovascular and Hemodynamic Recording
(Click to maximize) |
ControlLabScribe software and BIOSEB hardware combine to offer you better, more precise control of the experimental environment:
•
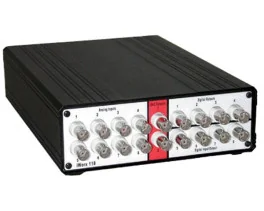
Twin DACs: LabScribe allows you to program two independent analog outputs. They can be used as independent stimulator outputs, or as linear controls for pumps or other hardware that accept an analog voltage as control. Built-in wave protocols include pulse, step, pulse train and DC. The two outputs can be combined to produce more complex protocols.
•
Digital Inputs: Up to eight digital inputs can be configured from the LabScribe software. Raw data, count frequency, and open times can be displayed in real time.
•
Digital Output: Up to eight digital outputs can be configured from the LabScribe software. Digital outputs can be used to control valves or relays in the experimental rig, or they can be configured in parallel to control serial devices.
Output sequences of events are created from an easy-to-use sequence builder that can include both the digital outputs and the analog outputs. Sequences are remembered by the LabScribe program and can be called manually or automatically.
 Key features
• XY Window & FFT Window
• Ability to set the default text in the journal
• Offset Control in Main window
• Bitmap buttons for AutoScale, Zoom In, Zoom Out, Full Scale in Research Mode
• AutoMark Dose Response
• Hide/Show Marks
• Apply units to all blocks
• Display Time can be changed while recording data
• AutoScale with Zoom In and Zoom Out capability
• Runs on Macintosh OSX, Linux (early 2007) as well as Windows
• Functions may be computed on functions
• Up to 128 channels of computed functions can be recorded
• New Views Manager allows unlimited views and up to 64 channels to be displayed in a view
• The voltmeter is independent of the channels in the Main window
• Switch between Preview Mode and Record. In Preview Mode data is displayed, but not saved
• Display of recorded data may be paused, but data continues to be saved to disk
• Display format (colors, fonts, line thickness) can be customized
• Sequences: a) Start and stop recording b) Display messages
• Events can be triggered by (positive trigger, negative trigger, in window, out of window) conditions on Data
• Improved Stimulator toolbar
• Journal can be displayed simulatenously with any window
• Improved Settings Manager
• Marker Channel in XY view, which allows easy identification of points of interest
• In ScopeView, multichannel view of selected sweeps
• Scope Sweep Manager, to manage sweeps in scope mode
• New functions: Moving Average and Savitsky-Golay Smoothing, Periodic (max dp/dt, min dp/dt, mean dp/dt)
 Pain - Thermal Allodynia / Hyperalgesia
 Pain - Spontaneous Pain - Postural Deficit
 Pain - Mechanical Allodynia / Hyperalgesia
 Learning/Memory - Attention - Addiction
 Physiology & Respiratory Research

 • XY Window & FFT Window
 Pain
Pain Metabolism
 Motor control
 Neurodegeneration
 Cross-disciplinary subjects
 Muscular system
 General activity
 Mood Disorders
 Other disorders
 Joints
 Central Nervous System (CNS)
 Sensory system
 Bioseb on booth #14 at OARSI 2024 in Vienna